
What makes information boards so popular, and what kind of needs does it meet?
Data-driven decision-making is gradually becoming the norm in all walks of life, and in this process, the information board has a very important position.
Its interactive and intuitive interface and the ability to visualize data on a single screen are regarded as key tools by business users. In addition, it is also favored by ordinary users and used in apps that manage daily activities, such as budget tracking or fitness management.
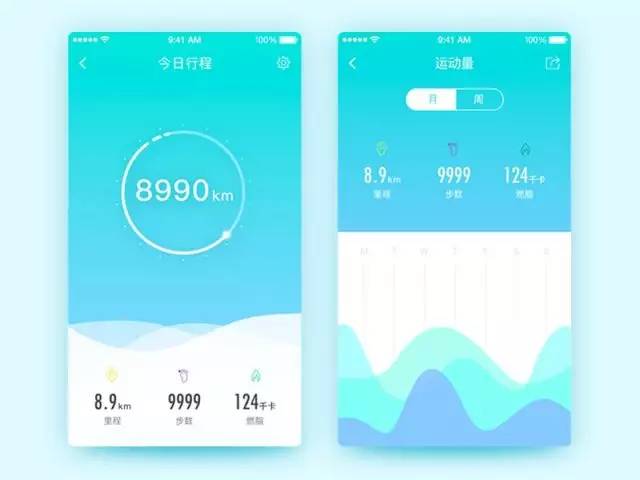
You can understand your exercise status through the information board
So, what makes the information dashboard so attractive? What kind of needs can people achieve with information boards?
Desire to control
We like the feeling of control. Imagine a situation where something happened but you don’t know what happened. Soon, the alarm bell rang in your heart, you want to know what happened, and you want to know what else you can control.
From an evolutionary perspective, if the environment is under our control, we will have a better chance of survival. Our subconscious mind prepares for various threats (fight or flight) based on the perceived control level.
The dashboard gives the user control. Whether it is a personal financial information board that can help you realize personal consumption trends, or a corporate marketing information center that can help you track marketing operations, they can better help you understand the situation and give you the kind of control you want feel.
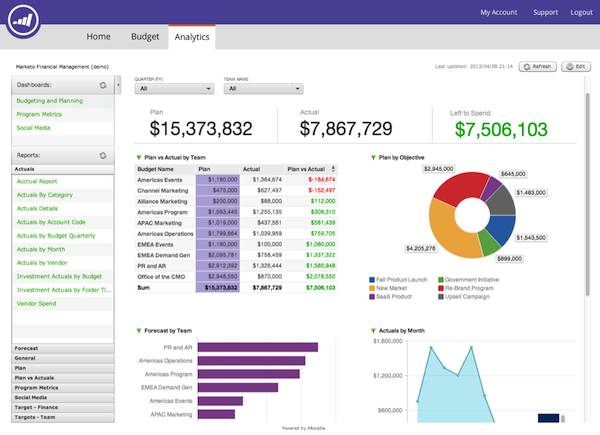
Help the marketing team to total budget and set investment goals
Most information boards use a triple strategy to establish a sense of control
- Provide a clear summary and establish certainty
- Provide resources that can predict and plan for the future
- Remind you to complete key tasks on time and avoid last-minute panic
Reduce reliance on short-term memory
Jakob Nielsen pointed out in the article “Short-term Memory and Web System Usability” that people cannot store too much information in short-term memory, especially when they are bombarded by multiple abstract or data fragments. He found through research that our short-term memory has only seven information blocks, and these information disappear from our brains after about 20 seconds.
Information boards can break through the limitations of short-term memory. By displaying all relevant information on a single screen within the user’s line of sight, the user’s reliance on short-term memory can be reduced. You don’t have to remember everything because they are right in front of your eyes.
However, in many cases, the data is too much to be presented on a single screen. There are three ways to solve the limitation of short-term memory:
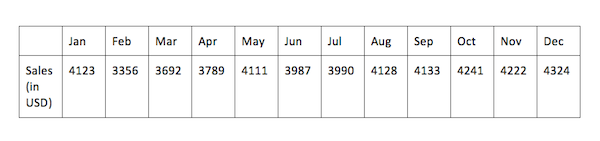
1. Use graphs or tables to reduce dependence on short-term memory
In order to better understand, we use two different methods (graph and table) to process the same set of sales data.
First is a data table:
Another line chart:
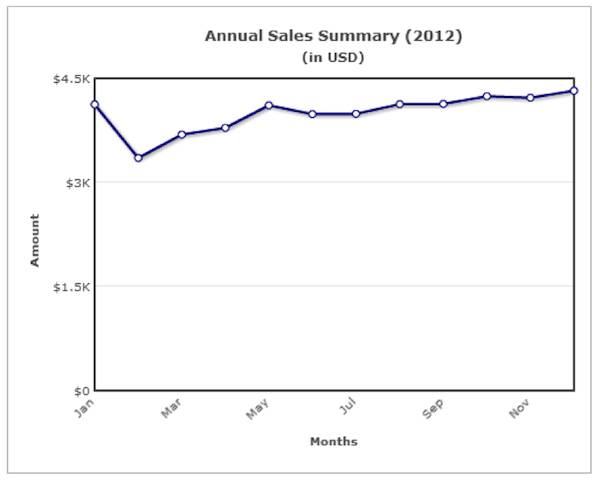
It is not difficult to see that a line chart is easier to remember the fluctuations in sales than a table that provides specific numbers.
2. Provide a summary or summary and set up detailed tracking
Summary browsing provides a single-page snapshot of key data, thereby reducing the burden of short-term memory. If the user needs more special details, you can get it in the drop-down options.
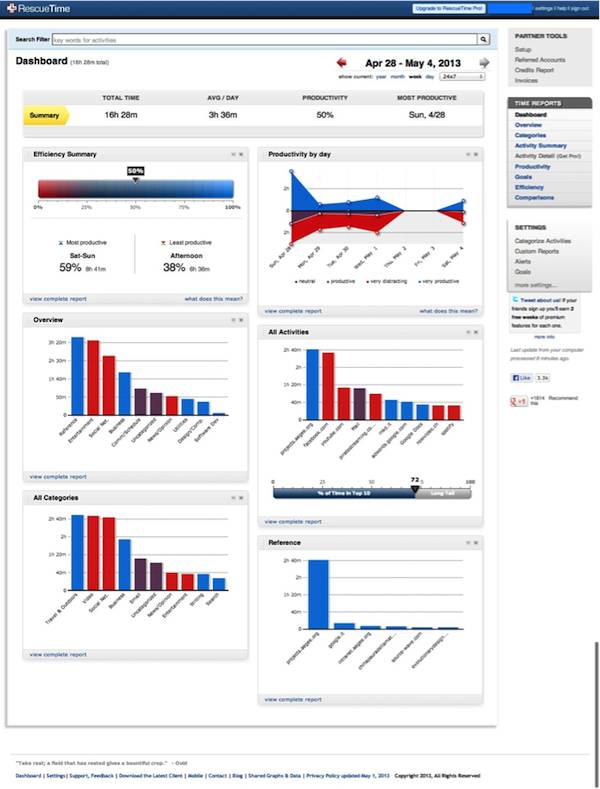
RescueTime helps you overlook the summary data and provides detailed data in the drop-down options
3. Compress a large amount of data in a table
By splitting part of the information into easy-to-understand data blocks, it can help users reduce cognitive load. In addition, when the related data is put in the same tabulation, it is easier for users to observe and analyze.
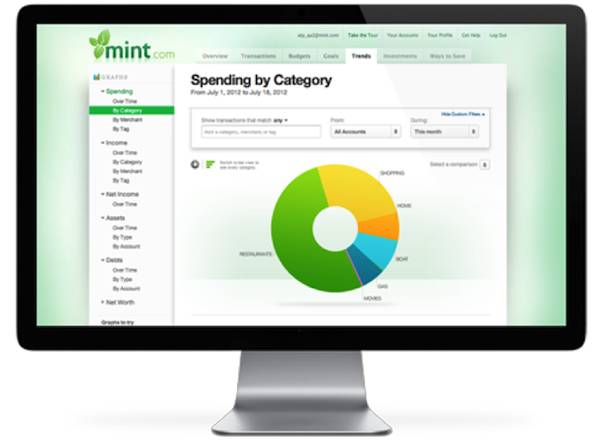
A table can have rich content tags: summary, transaction, budget, target, trend, investment and preservation method, etc.
easy to use
To simplify! In business, this is as useful as everyday life.
Let us analyze an inventory management system. When we use pen and paper to make records, it may take several hours to maintain the latest record of the inbound and outbound inventory (not to mention timely update). However, with today’s digital display panels, the time required can be greatly reduced.
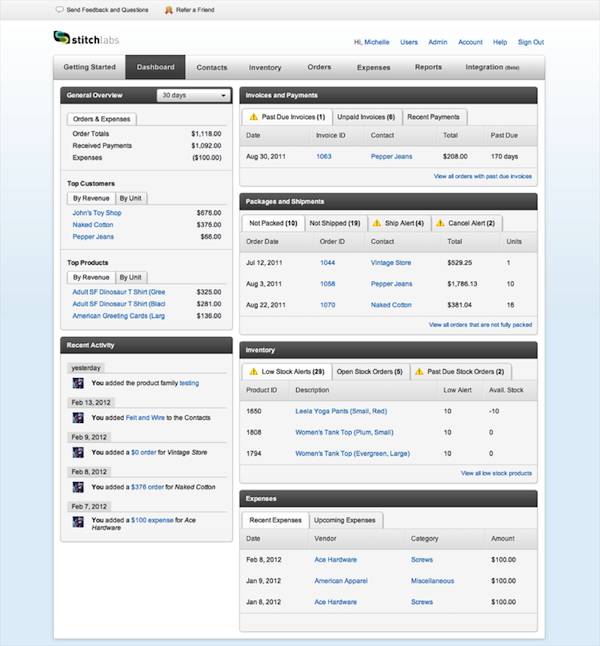
Stitch Labs allows merchants to monitor inventory across multiple sales channels
In addition, easy-to-operate design has become the benchmark of the digital industry. These information boards will gradually become device-compatible settings, providing users with access to information from the desktop. Accordingly, portable computers will be surplus like mobile devices.
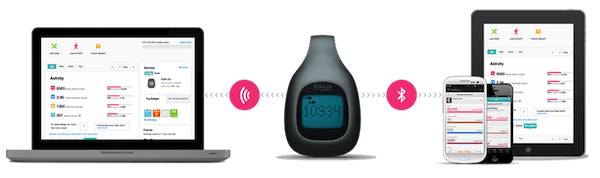
FitBit can be used interactively in different devices
summary
Any product that uses information boards as one of its key functions needs to maintain the psychological needs of its end users. Users like everything under their control, they have limited short-term memory, and they like things that are simple and easy to understand. The above three factors should form the basis of all information board designs. In summary, you need to understand the needs of your users, add your best design, and consider a variety of factors to create the perfect information board.
Information boards provide not only data, but also a pleasant experience of using data. Users can feel the future controllability in a way they like under light load. At the same time, the information board visualizes the data, making the data more intuitive and objective. Both business users and ordinary users can quickly understand and observe and track data. However, what kind of information board to provide depends on the situation by making full use of the above principles.
