When you choose the measurement method of usability research, you should consider a lot of issues to get the desired results, including research purpose, user goals, technical feasibility of collecting and analyzing data, and project budget and delivery A matter of time. Because every usability study has unique attributes, we cannot specify exactly what measurement method should be used for each type of study.
On the contrary, what we can define is the ten types of usability research that have been identified, as well as the reference recommendations for each type of measurement. We provide simple advice on how to perform a practical process of usability research with similar characteristics. Conversely, metrics that are essential for your research may not appear in the project list. At the same time, we strongly recommend that you dig deeper into the original data in your hands to find new measurement data, which is of great significance to the project goals.
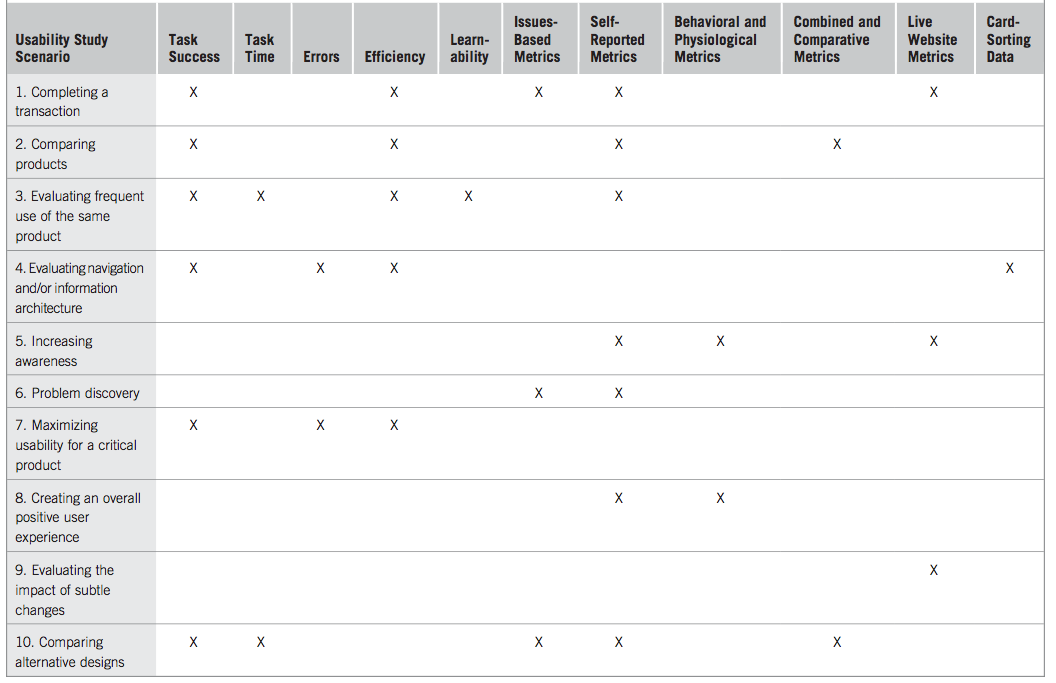
Ten commonly used usability research scenarios are listed in the table. The measurement methods that are commonly used or suitable for each usability research scenario are shown. The following chapters will discuss these ten scenarios separately.
1. Complete a transaction
The goal of many usability studies is to make the transaction as smooth as possible. There are various forms of transactions, which may require a user to complete a product purchase, register a new software, or sell a stock, etc. Transactions usually have a well-defined start and end point. For example, for an e-commerce website, when the user puts the fancy item in the shopping cart, the transaction may have already started, and when he confirms on the screen that the purchase is completed, the transaction also ends.
Perhaps the first availability metric you want to collect is whether the task was successfully completed. Whether each task succeeded or failed, this obviously needs to have a clear end state, for example, confirming that the transaction is completed indicates that the task was successful.
Reporting the success rate of participants’ transactions is a good measure to assess the overall effectiveness of the transaction. If the transaction involves a certain website, some online measurements of the website, such as the churn rate of the transaction, are also very useful. By knowing where users are lost, you can focus on the most problematic steps in the transaction.
Calculating the severity of a problem can help focus on the cause of a particular usability problem related to the transaction. By matching different severity levels for each usability issue, you can focus on dealing with high-priority issues that arise in any transaction. Two types of self-reporting metrics are also useful: likelihood of return and user expectations. In these cases, users can choose where to trade, and it is important to know what their experience is like.
One of the best ways to understand is to ask participants if they will use the product again, and whether the product meets or exceeds their expectations. When users have to complete the same transaction multiple times, then efficiency is a suitable usability metric. Efficiency is measured by the amount of task completed per unit time.
2. Product comparison
It is very useful to know where your product differs from competitors or previous versions.
Through comparison, you can accurately grasp the advantages and disadvantages of the product, and determine whether the improved version is really improved compared to the previous version. Using various usability metrics is the best way to compare the pros and cons of different products or versions. The measurement method you choose should be based on the characteristics of the product itself. Some products are designed to maximize efficiency, while others try to create the ultimate user experience (which is all different).
For most types of products, we recommend using three types of usability metrics to establish an overall sense of usability.
First, we recommend focusing on some successful tasks and adopting measurement methods. Being able to complete a task correctly is an indispensable requirement for most products. Efficiency also needs to be focused on. Efficiency includes the time to complete the task, the number of page views (for some websites), or the number of steps. By looking at the efficiency, you will have a perceptual understanding of how much effort the user needs to use the product.
Some self-reported satisfaction metrics provide a good summary of the user’s overall experience. The most meaningful thing about satisfaction measurement is that it can explain where and what choices users will make when using the product. Finally, the best way to compare usability between products is to perform integrated and comparative usability measurements. This allows us to have a clear and comprehensive understanding of different products from the perspective of usability.
3. Evaluate the frequency of use of the same product
Many products are designed and used based on the frequency of use.
For example, microwave ovens, DVD players, Web applications, etc., they are all used as part of work, and there are even software programs that we rely on to write this book. These products need to be easy to use and efficient. The amount of work required to burn DVDs or pop popcorn in the microwave is kept to a minimum. Most of us don’t want to waste time on products that are difficult to use, and we don’t have the patience.
The first usability metric we recommend is task duration. Measuring the time required to complete a series of core tasks will reveal the amount of work required for the task. For most products, the less time it takes to complete the task, the better. Since some tasks are inherently more complex than others, it is useful to compare the completion time of participants and expert users. Other efficiency-related usability metrics, such as the number of steps or the number of web pages (to measure the condition of some websites) are also useful. The operation time for each step may be short, but there are many decisions that need to be made to complete a task.
Ease of learning measures assesses the time and effort required to achieve maximum efficiency. Ease of learning can also take the form of previously used measures of efficiency over time. In some cases, self-reported usability metrics such as awareness and practicality can be considered. By measuring the difference between user awareness and self-perceived usefulness, you can determine which aspects of the product should be optimized or highlighted.
For example, users may not be aware of certain parts of the product, but once they use it, they will find these parts very useful.
4. Assess navigation and/or information architecture
Many usability studies focus on improving navigation and/or information architecture. This may be more common in websites, software programs, or consumer electronics.
Research may include ensuring that users can quickly and easily find what they want, easily switch between different sections of the product, and know where they are in the information level and what options they have to choose from. Under normal circumstances, these studies involve the use of wireframes or prototypes of some functions, because the design of navigation and information mechanisms and information architecture is very important and is the basis for almost any other design.
One of the best usability metrics for evaluating navigation is the mission success rate. By setting tasks for participants to find key information (such as playing a “treasure hunt”), you can understand whether navigation and information architecture play a role in the task. The search task should touch all areas of the product. One efficiency metric used to evaluate navigation and information architecture is the degree of disorientation , which compares the number of steps required by participants to complete a task (for example, the steps to access a web page) with the relative minimum number of steps to complete the task.
Card sorting is a particularly useful way to understand how users organize information. One type of card sorting study is called closed sorting, in which participants classify cards into pre-defined categories. A useful usability metric derived from closed card sorting research is the percentage of cards placed in the correct category to the total number of cards. This usability measurement shows the intuitiveness of the information architecture.
5. Raise awareness
Not every design for usability evaluation is designed to make the product easier or more efficient to use. The purpose of some design improvements is to increase the awareness of specific content or functions. This approach is necessary for online advertising, but it is also available for products that have important functions but are not fully utilized. There may be many reasons why some functions are not noticed or used, including some visual, label, or placement design.
First, we recommend monitoring the number of interactions of problematic elements. This is not foolproof, because the participant may have noticed something but didn’t click on it or just interacted to some extent. On the contrary, there is an interaction, but the opposite phenomenon will not happen without noticing it. Therefore, data can help confirm awareness, but it cannot indicate a lack of awareness. Sometimes self-reported metrics about whether participants notice or are aware of a particular design element are also useful.
The method of measuring obviousness is to point out specific elements to the participants and ask them if they noticed these elements during the course of the task. Awareness measurement involves asking participants if they understand a certain function of the product before the start of the study. However, it is not yet clear how reliable these data are. Because not everyone has a good memory, some people try to save face by saying that they saw it, even though it is not. Therefore, we do not recommend that this is your only evaluation method, and you should collect other data sources to supplement your results.
Memory is another useful self-reporting measure of usability. For example, you can show participants a few different elements, in fact there is only one element they have seen before, and then let them choose which one they have seen in the task. If they noticed this element, they are more likely to remember than guess. But if you have the technology available, perhaps the best way to assess consciousness is to measure behavioral and physiological data, such as eye tracking data. Using eye tracking technology, you can determine the average time spent searching for a particular element, what percentage of participants are looking at it, and even the average time it takes to notice it for the first time.
When evaluating a website, another metric to consider is changes in online website data. Observing changes in traffic patterns in different designs will help you determine the relationship between them and perceptions. Simultaneous testing (A/B testing) of alternative designs on live web sites is an increasingly common way to measure how small design changes affect user behavior.
6. Find the problem
The purpose of finding the problem is to identify the main usability problem. In some cases, you may not have any preconceived ideas. You don’t know which usability problem is the most important on the product, but you want to know what annoys users. This method is often for existing products that have not yet been tested for usability.
Problem-finding research can also be used to periodically check how users use the product and how they interact with each other. Problem discovery research is different from other types of usability research because it is usually open.
Participants in problem discovery research may complete their own tasks instead of the specific tasks you specify. Keeping as authentic as possible is also important for research. This often involves the product that the user is using and the user through their own account to complete some tasks that are only related to themselves. It may also include an assessment of the environment in which participants use the product, such as at home or at work.
Because they may be completing different tasks and the usage scenarios may be different, it may be a challenge to compare the various participants. Problem-based metrics may be the most suitable for problem discovery. Assuming you have captured all usability issues, it is easy to convert this data into frequency and type. For example, you may find that 40% of usability issues involve high-level navigation, and 20% of issues are related to confusing terminology.
Although the specific problems encountered by each participant may be different, you can still generalize to a higher-level problem category. The frequency of inspections and the severity of specific issues will reveal how many duplicate issues are being discovered. Is this a one-off incident or is it a recurring problem? By cataloging all the problems and their severity, you can get a list of quickly optimized designs.
7. Maximize the availability of key products
Although some products strive to be easy to use and efficient, such as mobile phones, washing machines and other products, some products must be easy to use and efficient, such as electric shock devices, voting machines, or emergency exit instructions on airplanes. The difference between key products and non-key products is that the whole reason for the existence of key products is to complete a very important task for users. Failure to complete the task will bring very serious negative consequences.
Usability testing is essential for any critical product. But just a small amount of user testing in the lab is not enough. Target-based user performance measurement is very important. Any critical product that fails to meet its usability goals needs to be redesigned. Since these data must have considerable credibility, you may need to invite a large number of users to participate in the research. A very important usability metric is user error. This may include the number of errors or misoperations in performing certain tasks. Errors are not always easy to define, so how to define errors requires special attention. It is best to clearly define what is wrong and what is not.
The success of the task is also an important basis for evaluation. In this case, we recommend using a binary method to deal with it. For example, the most realistic measurement of the usability of a portable electric shock device is that someone can successfully operate and use it alone.
In some cases, you may want the success of the task to be evaluated by more than one metric, and you may want the task to be completed within a specific time without errors. Other availability metrics related to efficiency are also useful. Let’s take the electric shock device as an example. It is one thing to use it correctly, and it is another thing whether it can be completed quickly and in a timely manner within a limited time. Self-reported indicators are less important than key products. How users want to use the product in their hands is not important, what is important is that they actually use it successfully.
8. Create a holistic and positive user experience
For some products that want to work hard to create an outstanding user experience, only having usability is not enough. These products need to be both attractive and thought-provoking, entertaining, and even make users a little addicted.
iPod and TiVo are two products that I can think of. These products, even if you and your friends talk about it at a party, it doesn’t hurt. The popularity of this product usually rises at an alarming rate. Although the product’s good user experience characteristics are very subjective, they are still measurable.
Although some performance metrics may be useful, what really matters is what the user thinks, feels, and how to describe his or her experience. In some ways, this is the opposite of measuring the usability of a key product. If the user experience is not smooth at first, this may not be the end of the product. What really matters is how many users feel after the end of the day. When measuring the user’s overall experience, self-reported metrics must be considered.
Satisfaction may be the most common self-reported measure, but it may not be the best one. Just being “satisfied” is usually not enough. One of the most valuable self-reporting metrics we use is user expectations. The best experiences are those that exceed user expectations. When the participant says that the product is easier, more efficient, and more interesting than he previously expected, you know you did it.
Another self-reporting metric involves future use. For example, you may ask questions such as: what is your purchase preference, whether you would recommend it to a friend, or whether you will use it in the future, etc. Another interesting usability metric involves the subconscious reactions that users may have. For example, if you want to make sure your product is attractive, you can observe the physiological data of the user. Changes in pupil diameter can be used to measure arousal levels, or if you want to relieve stress as much as possible, you can measure changes in heart rate and skin conductivity.
9. Assess the impact of minor changes
Not all design changes will have a significant impact on user behavior.
Some design changes are very small, and their impact on user behavior is not very clear. But even a small change, as long as there are enough users, it can also have a huge impact on the user group. Such minor changes may be different aspects of visual design, such as font and size selection, element position changes, visual contrast, color and image selection, etc. Non-visual elements, such as subtle changes in content or terminology, can also affect the user experience.
Perhaps the best way to measure the impact of minor design changes is through real-time online measurement of website A/B testing. A/B testing involves comparing the original design with an alternative design. For websites, this method usually transfers part of the network traffic to alternative designs, and then contrasts the results of the data, such as comparing website traffic or product purchases with the original design. An online usability study with a large number of users can also be very useful. If you do not have the technical requirements for A/B testing or online research, we recommend that you use e-mail and online surveys to get feedback from participants as representative as possible.
10. Comparison of alternative designs
One of the most common types of usability research is the comparison of multiple alternative designs. Normally, these types of research occur early in the design process and are completed before any design is fully optimized.
(We usually call these “design baking”) Different design teams work together to complete the design of multifunctional prototypes, and we evaluate each design based on predefined usability metrics. There is a small technique for conducting such research. Because design schemes are often similar, users may have a high learning effect from one design to another. Allowing the same participant to perform the same task in different designs usually does not produce valuable information, even if the design scheme and the sequence of design tasks are deliberately balanced, it cannot be offset.
There are two solutions to this problem. You can set the research to be conducted between purely different design subjects, that is, let each participant use only one design. This can obtain a data set free from interference, but requires more participants to join. Or, you can ask participants to use one main design to complete the task (balanced design), then show other designs and ask their preferences. This way you can get feedback on all designs from each participant.
When comparing many design options, the most appropriate metric is based on a problem-oriented metric. Comparing high, medium, and low design solutions with different severity levels will help reveal which design or designs are more useful. Ideally, the final design should be a design with fewer overall problems and fewer problems with higher severity.
The measurement of task success rate and task completion time is also useful, but because the sample size is usually small, these data are often of limited value. Two self-reporting metrics are particularly useful. One is to ask each participant to choose the design prototype they are most willing to use in the future (as a comparison of forced choices). At the same time, requiring each participant to evaluate according to different evaluation dimensions, such as ease of use and visual appeal, can also help find problems.
